Subject: Can You Spot The Winning Trades On This Chart?

Hi Folks.


So I haven't been bombarding you with email about the new Line Break trading charts, mostly because I've been busy answering questions and handling customer service issues.


But the clock is running out and I'll be taking it off the market at some point in the next 24 hours (I usually try and take them down on Sunday night but I've been going to bed early the last few night so I'll likely hold off until Monday morning.


So you have about 24 hours left to grab Line Break for MT4, MT5, NinjaTrader 8 AND Trading View, for just $49.


The link is https://simplicators.com/linebreak


But before you click over, look at the following chart and ask yourself, could I make money trading a chart like this?


More importantly, could I make money trading a chart like this if I knew for sure neither the candles nor the arrows repaint, even a little bit?


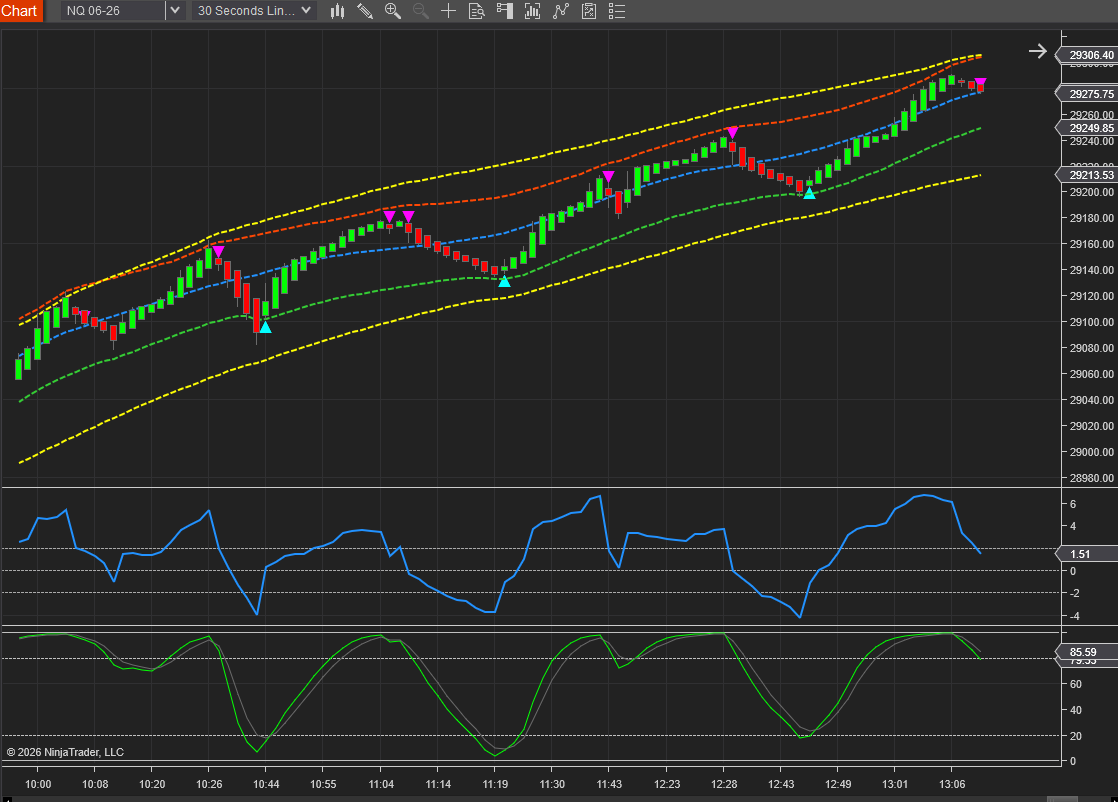
I hope the answer you come up with is Yes, I can definitely trade a chart that looks like that, and successfully.


I can't make it any easier for you than this. If price is near the bottom of the bands and you get a Buy arrow, take the trade. If price is near the top of the bands and you get a Sell arrow, take the trade.


And just FYI, if you trade with MT4 and MT5, this is the only time you'll see this offered ever again.


Moving forward with my advertising I will only be focusing on NinjaTrader and TradingView traders.


And the price will be significantly higher than $49.


So don't let this one slip out of your fingers.


Grab your copy of Line Break while it's still available at the introductory price (and still available at all for MT4 and MT5).


Here is the link again: https://simplicators.com/linebreak


Jeff


Powered by:
GetResponse