Here are seven ways that Locus helps customers visualize their environmental data
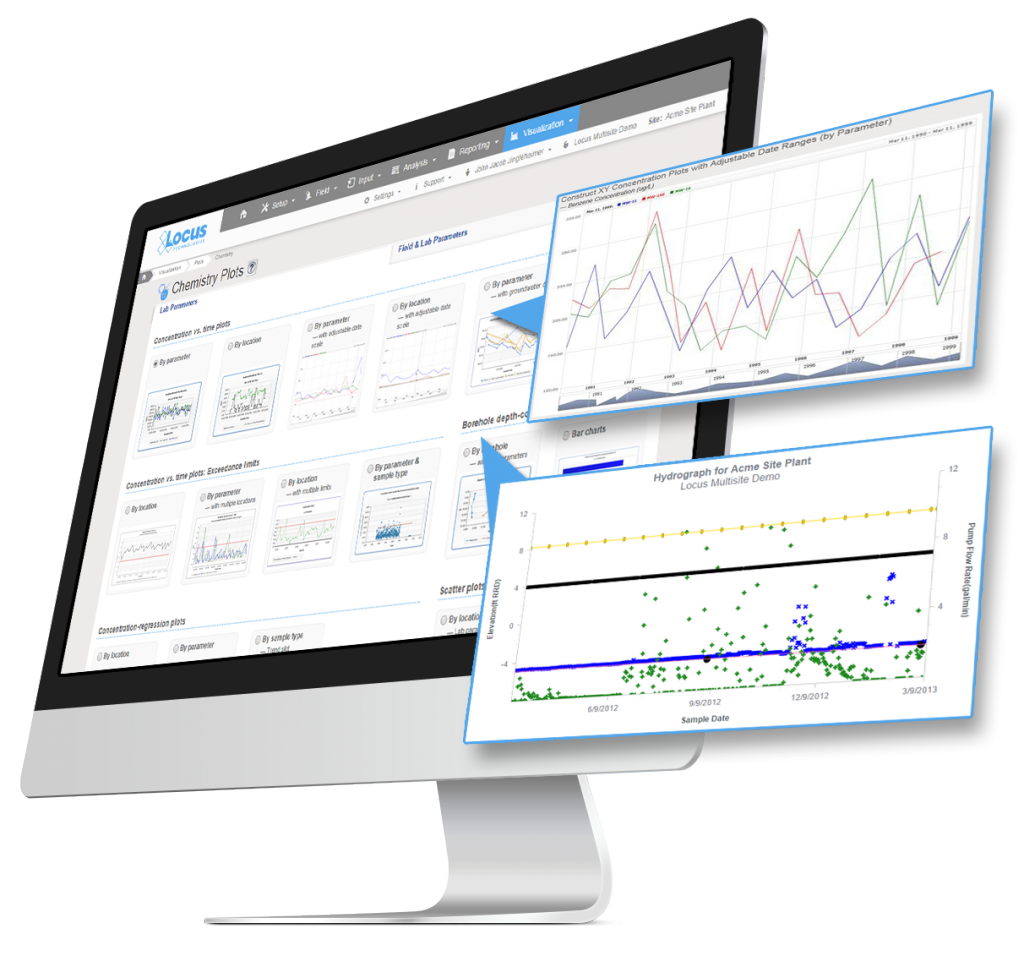
7 Useful Visualization Tools for Environmental Management | | The ability to visualize field and analytical data across maps, logs, and charts is a crucial part of managing environmental information. Locus makes it easy to visually display and export data for sharing in reports and presentations. We’ve compiled 7 of the most useful visualization tools in our environmental information management software. | |
|
|
Thank you, from the Locus Team. | Don't hesitate to contact us if you have any questions. | | |
|
|
|